This posting is part of a series detailing how to write a custom Debugger Visualizer for Visual Studio.
Posts in the series:
- Writing A (ReadOnly) Custom Debugger Visualizer for Visual Studio
- Writing A Custom Debugger Visualizer for Non-Serializable Types or More Complex Objects
- Writing A Custom Debugger Visualizer using WPF for the UI
- Modifying The Live Object in Your Custom Debugger Visualizer for Visual Studio
- Installation, Limitations, and Security Considerations for Your Custom Debugger Visualizer for Visual Studio
I've also given a talk on this topic: Putting the Visual into the Visual Studio Debugger.
You can find code samples to go along with this series in my DebugVisualizer GitHub repository.
Doing it the hard way!
You've hit your Visual Studio breakpoint, opened the watch window and you're looking at a wall of nested collections and object graphs. You know the data you want is in there, but digging it out of the built-in data table UI feels like the "doing it the hard way" part of an infomercial.
Now, imagine being able to shape your data the way that makes it easiest to understand and debug, limited only by your imagination (and time, of course).
This is the potential embodied in the Visual Studio Debugger Visualizer feature, available in all version of Visual Studio on Windows (even the free Community edition!) that lets you create your own graphical display of your .NET data structures while debugging. Shape the data the way you want to make it easier to digest -- hide unimportant info, quickly expose deeply nested elements, compare large object graphs, or even instantly search Stack Overflow for help with an Exception. Display it in whatever way is best for your data and your understanding of it, act on the data and even modify the it from your custom view.
Backup! What's a "Debugger Visualizer" Anyway?
You've probably already used the Debugger Visualizer feature with one of the built-in visualizers that ship with Visual Studio.
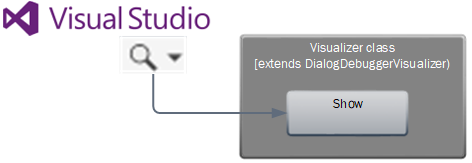
When debugging from within Visual Studio, you will at times see a small spyglass icon alongside data in the Locals, Auto, Watch and QuickWatch windows. This is the entry point to any visualizers that are available for the current item's Type. Clicking the arrow will show you a drop-down menu with all of the registered visualizers for that type, while clicking the spyglass itself will start the default/last used visualizer for that Type.
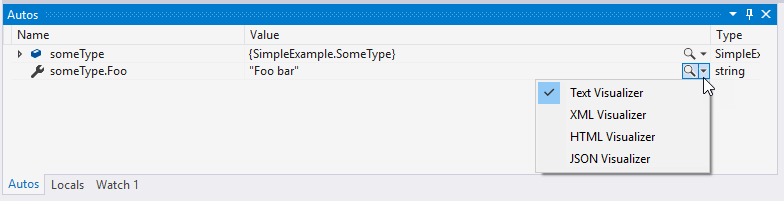
In the above screenshot, you can see the four built-in visualizers for the System.String type:
- Text
- XML
- HTML
- JSON
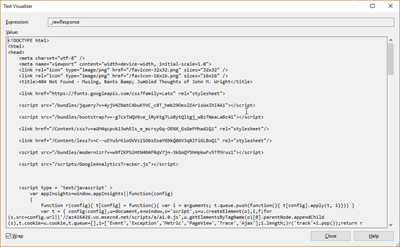
The Text visualizer just displays the string, in it's entirety, in a window. This is particularly useful when you have very long strings, such as exception stack traces. The others will attempt to format the string based on the data structures they represent.
Text Visualizer (with a string of HTML shown):
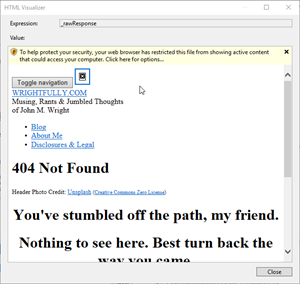
HTML Visualizer will display the string in a web browser control:
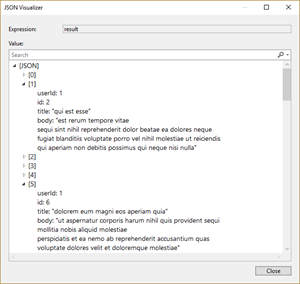
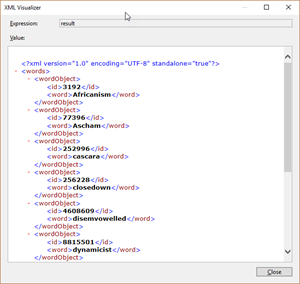
The JSON and XML visualizers will provide collapsible areas for nested data within the structure being visualized:
Additionally, Visual Studio has a WPF Tree visualizer and a DataSet/DataView/DataTable visualizer.
In each case, the visualizer makes it easier to interpret and understand the data -- well beyond what you can do from the small snippet of a string you see in the watch windows directly.
Going Beyond The Basics
Ok, so you can visualize a string -- great. But if you want to visualize a custom data type, or do something more complex, you're going to need to build your own (or use one someone else has built -- but see the Security Considerations section first!).
There's an existing page on the Microsoft documentation site on Writing a Visualizer in C#, but I found it hard to digest without understanding all the parts already, so my goal here is to break it down into something a bit easier to understand.
In this post, I'll walk through creating a read-only vizualizer. I'll expand upon this base in the next post and show how to create a vizualizer that lets you modify the object you're viewing.
The Components Involved
Ultimately, there are six components required for a custom debugger visualizer, in addition to Visual Studio and your app itself. However, for some cases, Microsoft provides implementations of the components, so you don't have to do the work.
The components fall into two buckets: Those that run within Visual Studio's debugger and those that run within your application (the one you're debugging).
Note: There are the minimum components you need. Later in this post, I'll touch on a few additional class you may want to add to make your implementation easier.
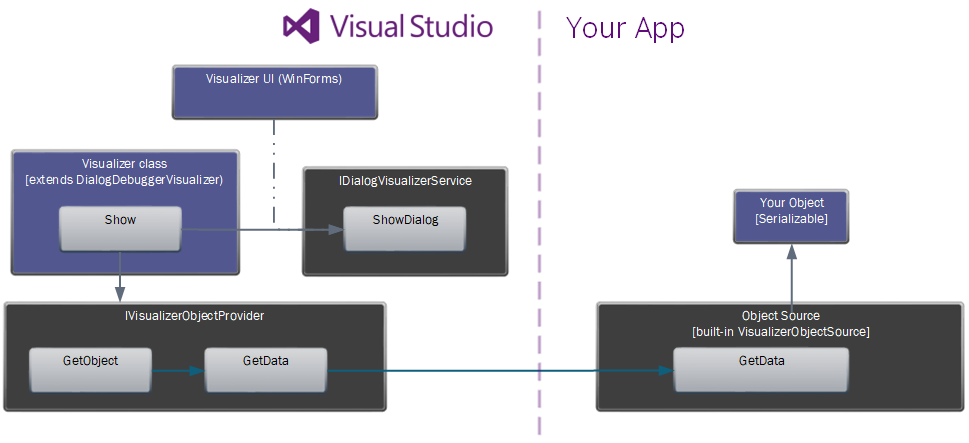
Bucket 1: Your Application
The first two components fall into the application side of the equation:
- The Type you want to visualize.
- This one's easy. You want to visualize a type -- so you need that type. It can be any type: one you've created, one within the .NET framework, or a third-party library. You don't need access to the source code, as long as what you want to show in the visualizer is available from the object's members to which you have access.
The one requirement: It must be Serializable. If it's not (and you can't make it serializable), don't worry -- I'll talk about using a ViewModel class as an alternative in my Writing A Custom Debugger Visualizer for Non-Serializable Types or More Complex Objects post.
- This one's easy. You want to visualize a type -- so you need that type. It can be any type: one you've created, one within the .NET framework, or a third-party library. You don't need access to the source code, as long as what you want to show in the visualizer is available from the object's members to which you have access.
- A
VisualizerObjectSourceobject.- This is a class that extends the
Microsoft.VisualStudio.DebuggerVisualizers.VisualizerObjectSourceclass (which is in theMicrosoft.VisualStudio.DebuggerVisualizersassembly and installed with Visual Studio). The purpose of this object is to provide a serialized version of the Type upon request from aVisualizerObjectProvider(you'll see this in a second under the Visual Studio bucket). There are only three methods in this class (with two additional static helper methods) and I'll talk about all of them below.
- This is a class that extends the
Bucket 2: Visual Studio
There are four additional components on the Visual Studio side:
- The UI form/control
- This is a WinForms-based
FormorControlobject that is the UI of your visualizer. Yeah, I said WinForms. But don't worry, you can host WPF controls easily and I'll show you how in my Writing A Custom Debugger Visualizer using WPF for the UI post.
- This is a WinForms-based
- An
IDialogVisualizerServiceinstance.- This is the easiest of the all, because Visual Studio will give it to you as a parameter when calling your
VisualizerObjectProvider(see below). It consists only of three overloads of aShowDialogmethod, each taking a differentFormorControltype and displaying it.
- This is the easiest of the all, because Visual Studio will give it to you as a parameter when calling your
- An
IVisualizerObjectProviderinstance.- This too is provided as a parameter by Visual Studio, so you don't need to implement your own. It acts as the communication between the Visual Studio bucket and your application. A call into this object results in a specific method being called on the
VisualizerObjectSourceobject on the other side.
- This too is provided as a parameter by Visual Studio, so you don't need to implement your own. It acts as the communication between the Visual Studio bucket and your application. A call into this object results in a specific method being called on the
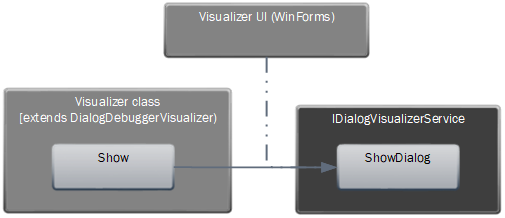
- A class that extends
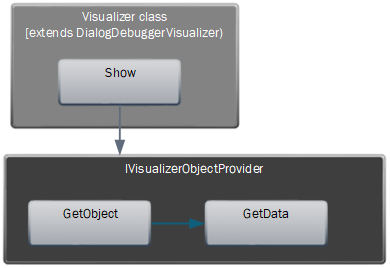
DialogDebuggerVisualizer- This is where everything is glued together. When a user selects a visualizer to run, this is the code that gets called. It has one method you must implement:
Show. Visual Studio will pass you theIDialogVisualizerServiceandIVisualizerObjectProviderand you run with it from there.
- This is where everything is glued together. When a user selects a visualizer to run, this is the code that gets called. It has one method you must implement:
The Logical Flow (For a Read-Only Visualizer)
Now that we have all the components defined, here's how they all work together:
When the user clicks the spyglass icon within Visual Studio, the selected Visualizer's Show method is called.
Visual Studio will pass into it an instance of IDialogVisualizerService and IVisualizerObjectProvider.
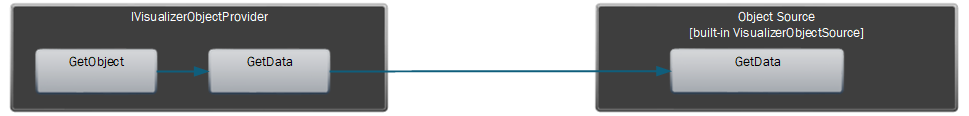
Within your Show method, you'll use the IVisualizerObjectProvider to request the live object from your application.
You have two method options to do this:
GetData(), which will return aStreamwhich you must deserialize yourself into the type being transferred.GetObject(), which will callGetData()and deserialize the stream for you and return anobject(which you can cast to the type being transferred).
When you call GetData (directly or via GetObject), that will result in a call to GetData in the VisualizerObjectSource you've implemented on the application side.
The VisualizerObjectSource.GetData() method has two parameters (and no return type): - The live instance of the object being visualized. (This will come in as an object type, so you'll need to cast it to the type if you need to access it directly). - A "outgoingdata" Stream.
Within this method, you'll need to serialize the live object and feed it onto the outgoingdata Stream. This stream is what is returned by IVisualizerObjectProvider.GetData() on the Visual Studio side.
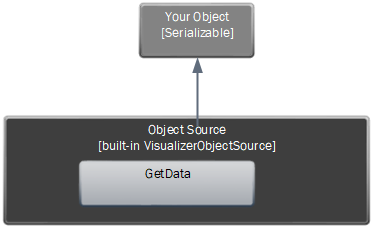
Tip: The VisualizerObjectSource class has two static helper methods (Serialize and Deserialize) to make it easier for you if you decide not to use GetObject.
Now that you have a deserialized instance of your live object, you'll create an instance of your UI control and populate it with that object's data. Then, call IDialogVisualizerService.ShowDialog, passing it your UI control. This will show the form to the user.
Implementing a Read-Only Visualizer
Enough talk -- let's see some code!
Note: I'm going to create a very simple visualizer here to show the mechanics and reduce noise. I'll expand on this in the other posts in this series.
You can find code samples to go along with this post and others in this series in my DebugVisualizer GitHub repository.
The Type To Visualize
Here's the Type I want to visualize. It's got a string member named Foo that's public (so it's accessible by my visualizer) and it's marked as [Serializable].
using System;

namespace SimpleExample
{
    [Serializable]
    public class SomeType
    {
        public string Foo { get; set; }
    }
}
The VisualizerObjectSource
Now, here's a little secret: If you're type you want to visualize is serializable and you're only creating a read-only visualizer, you don't actually need to implement your own VisualizerObjectSource. You can use the actual VisualizerObjectSource class itself, which will serialize your object using the static helper method VisualizerObjectSource.Serialize (which, in turn, uses .NET's BinaryFormatter.Serialize).
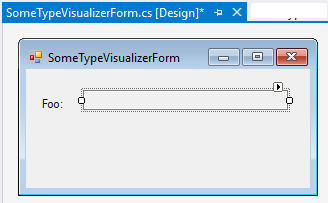
The UI
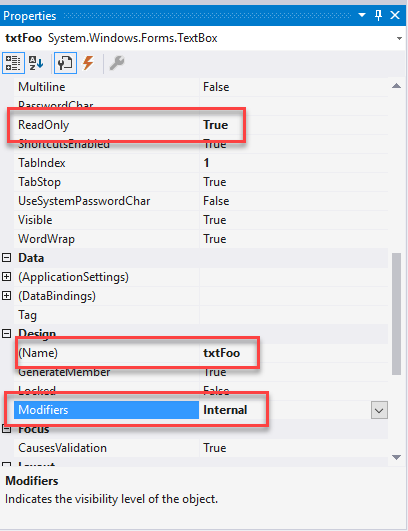
I've created a very simple WinForms Form with a Label and a TextBox named txtFoo. I've made the TextBox readonly and set the Modifiers value to Internal so my visualizer can set it directly.
The Visualizer
The final piece needed for this very simple visualizer is the actual visualizer class. I'm creating a class (SomeTypeVisualizer) that extends DialogDebuggerVisualizer and provided an implementation for the abstract Show() method. In the Show method, I do the following:
- call
GetObject()on the objectProvider to get an instance of the object to visualize and cast it to mySomeTypetype. - create an instance of my UI form and populate the UI's textbox with the value from my object.
Call
ShowDialogon theIDialogVisualizerService, passing it my UI control.using System; using Microsoft.VisualStudio.DebuggerVisualizers; namespace SimpleExample.DebuggerVisualizer.SomeType { /// <summary> /// A Visualizer for SomeType. /// </summary> public class SomeTypeVisualizer : DialogDebuggerVisualizer { protected override void Show(IDialogVisualizerService windowService, IVisualizerObjectProvider objectProvider) { if (windowService == null) throw new ArgumentNullException(nameof(windowService)); if (objectProvider == null) throw new ArgumentNullException(nameof(objectProvider)); // Get the object to display a visualizer for. // Cast the result of objectProvider.GetObject() // to the type of the object being visualized. var data = objectProvider.GetObject() as SimpleExample.SomeType; // Display your view of the object. using (var displayForm = new SomeTypeVisualizerForm()) { displayForm.txtFoo.Text = data.Foo; windowService.ShowDialog(displayForm); } } } }
Registering the Visualizer
The final step is letting Visual Studio know that I've created a visualizer and when it should be used. This is done using the System.Diagnostics.DebuggerVisualizer attribute in one of two ways:
- On the
SomeTypeclass itself. - At the assembly level.
In it's simplest form, The DebuggerVisualizerAttribute takes in the type of the visualizer, either as a Type or as a string of the fully-qualified type name. Since this is my super-simple example, I'm going to use that register it on the SomeType class itself by adding the DebuggerVisualizer attribute:
[DebuggerVisualizer(typeof(SomeTypeVisualizer))]
[Serializable]
public class SomeType
{
    public string Foo { get; set; }
}
Alternatively, I could register it at the assembly level by including this attribute somewhere in my assembly. If you do this, In this instance, you have to provide the Target type to let Visual Studio know what type this visualizer is being registered for.
[assembly: DebuggerVisualizer(typeof(SomeTypeVisualizer), Target=typeof(SomeType))]
Since my visualizer is defined in the same solution as I want to use it, I don't have to install it anywhere. If I wanted to have a set of visualizers in a separate assembly that are always available, I'd need to install them into a known location that Visual Studio searches (see the Installation, Limitations, and Security Considerations post).
Testing The Visualizer
If you want to be able to test your visualizer UI without actually having to debug an app, Visual Studio provides a way to do that using the VisualizerDevelopmentHost class. This class has a few different constructors for providing the object you want to visualize, your visualizer, and optionally the VisualizerObjectSource type. In our simple case where we're using the default VisualizerObjectSource, we can use it like this:
 VisualizerDevelopmentHost visualizerHost =  new VisualizerDevelopmentHost(objectToVisualize, typeof(SomeTypeVisualizer));
 visualizerHost.ShowVisualizer();
Throw that into a console app and you're good to go.
And now I can use my simple visualizer anytime an object of SomeType is available in the debugger:
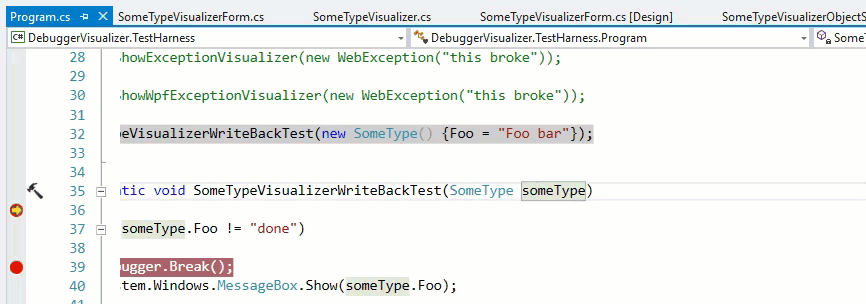
Bam! We're done -- at least with a simple example. But you've got the basics now and just need to apply it to your own types.
Make sure to take a look at the other posts in my Debugger Visualizer series.