
In the world of software development, your job is take the complex and make it manageable, whether that's automating business processes, visualizing and aggregating massive data sets, or rendering life-like vector images in real-time, your job is to allow non-developers to interact with the application (or it's outputs) in a way that simplifies the complexities and allows them to focus on the aspects of the business/data/entertainment that is important to them.
But many programmers forget that we have the same issues. Our codebases begin to suffer from the same complexity problems over time. This is especially true for large systems that have aging code bases and large numbers of developers (over time) with their hands in the code. So we, too, need to keep an eye on minimizing complexity in our own domain, our code, so that we can concentrate on the task at hand instead of suffering through technical debt and bit-rotting architectures.
I'm a huge fan of continuous improvement, and I've mentioned tools like Sonar and JetBrain’s ReSharper in the past that help quickly locate problematic areas and facilitate that continuous improvement process.
So when Patrick Smacchia (lead developer for NDepend, and I think sole developer/CEO) contacted me to request I review the NDepend tool in exchange for a free license, I was happy to do so.
Quick links to sections of this review:
General Conclusions:
NDepend is a very powerful static analysis tool for .Net codebases that provides HTML reports and interactive GUI(s) for finding overly complex or problematic areas of your code, performing analysis for refactoring and comparing changes over time. In version 4, a LINQ-like query language was added that makes the tool an extremely powerful reporting engine and can be used to enforce coding standards rules on your build systems similar to FxCop or unit testing frameworks.
While NDepend provides a very powerful backend, it's frontend, Visual NDepend, suffers from some usability issues that I feel distract the user from the power the underlying tooling provides. With some time, you can get proficient using the tool and have access to a world of data about your codebase. And hopefully the NDepend developers can address some of the usability issues in future releases.
I don't see NDepend as a tool that you'd buy for every developer on your team; but I do see value in having dev leads/architects utilize the tool, as well as having it integrated into your build/Continuous Integration process. This will allow you to 1) monitor changes over time to ensure the development team isn't adding unmerited complexity or incurring inappropriate technical debt and 2) discover high-risk/difficult to maintain areas that you should prioritize while paying down your technical debt.
General Feature Overview:
NDepend is, at it's core, a static analysis tool for .Net assemblies. It can be run against the assemblies themselves, or by way of a Visual Studio solution. If running against assemblies, and .pdb files exist, NDepend will pull the source code metadata from the .pdb file and import the source code directly as well. The analysis is pretty rich and includes dependency graph resolution, cyclomatic complexity calculations, coupling, abstraction, % comments, Lines of Code, etc, etc. One interesting bit -- several of these are calculated for both the raw source code as well as for the IL, so you can see where your code might end up generating some ugly IL even if the C# isn't so bad.
In addition to the current analysis, given access to the output of previous runs, NDepend can show you differences between snapshots. This provides some really nice datapoints, such as breaking changes to public APIs. You can also import code coverage reports from some unit testing tools, which allows you to also gather metrics around unit test coverage.
All of this is exposed though several different reports and visualizations, from dependency matrix to heat maps, and when run in the NDepend GUI, they are interactive and configurable. These are great for exploring a systems architecture and evaluating potential refactorings, such as assembly consolidation/splitting.
But the really powerful piece seems to be the Code Quality LINQ (CQLinq) feature, which allows you to write LINQ queries against the code analysis data to generate your own reports and create code quality rules to enforce good coding standards. A set of pre-defined rules is provided as well, including in-line comments explaining the query for quick reference. And with the NDepend console runner, you can easily integrate NDepend analysis into your CI builds. So image the ability to write a LINQ query to find all methods which have high cyclomatic complexity and low code coverage. Or write a rule that will fail the CI build if a public API has a breaking change. Or if a large method grows even bigger, etc, etc.
Additionally, NDepend provides an API for writing your own tools to hook into pretty much any of the NDepends functionality, from creating NDepend projects, running analysis and interacting with the results. A set of sample "power tools" is also provided, including source code, that utilize the API to perform several tasks. So you could use this API to further automate your analysis, such as writing custom hooks for FxCop, Sonar, data warehousing, etc.
A larger list of NDepend features can be found on their website.
I’m a firm believer that people are better able to comprehend complex data when accompanied by a graphical representation of the data. I also understand that people vary as to how they process data, and there is typically not a one-size-fits-all data visualization that will sink in for everyone. NDepend is a great tool for this, as it provides multiple visualization techniques for exploring your code and the metrics gathered during analysis.
Below is a listing of the major views within VisualNDepend and the HTML reports, of which I believe Dependency Matrix and Query and Rules Explorer to be the most useful generally, and very powerful in “real world”/day-to-day development efforts. Additionally, you can flip between many of the view to get a different viewpoint for the same data – for instance, you can be working in the Dependency Matrix and double-click an assembly/member to jump to the Dependency Graph for that element. In many cases, particularly when look at method-level data, you can jump directly to the code in Visual Studio, allowing you to fix the problems as you come across them, which is a nice touch. You can also run NDepend within Visual Studio for an even tighter integration.
Dependency Matrix

This view shows dependencies between assemblies (and their members) and other assemblies in the project, with all of the assemblies listed on both axis and the number of dependencies (usages) between any two assemblies noted in the box where their two axis intersect. For example, my “common.tests” project uses the “nunit.framework” assembly, so where the two intersect, I would see a number. In the case where my assembly is on the horizontal axis, the number would be in green, indicating a “uses” relationship. If nunit is the assembly on the horizontal axis, it would show the number in blue, indicating a “used by” relationship. The nice thing is that the context-sensitive help (the popup dialog shown in the above screenshot) explains all of this, so you don’t have to remember it all.
Each assembly on both axis also have a tree-view expander (little + sign), where you can explode out the assemblies’ namespaces and see these dependencies' at a namespace and member level. This is a tremendously helpful tool when moving types around between assemblies or attempting to merge or split assemblies. We’re actually in the process of doing exactly this at work, where we are removing UI-dependent and platform-specific code from one of our “common” assemblies and the person doing the work is using (an older version of) NDepend to inspect the relationships in order to know what can be moved and in what order to prevent build issues. Additionally, it greys-out (or hashed-out) the columns which are not accessible (ie: internal, protected, etc), which is helpful.
Here is another screen cap with the exploded tree views in the dependency matrix, showing my common.tests assembly on the horizontal axis and nunit.framework on the vertical, where the TestAdd() method in my assembly uses the Assert.IsNotNull(Object) method of the nunit.framework assembly.

Another really nice touch on the dependency matrix view, when looking at assembly-to-assembly dependencies, is that a “0” is shows in the intersection square if the assembly defines a dependency to an assembly (ie: includes a reference in Visual Studio), but doesn’t actually use the assembly. This is a clear code smell, since this is only really ever valid if you’re loading the assembly via reflection, which has it’s own code maintenance issues.
Dependency Graph

This view shows nodes, who’s size is configurable by a drop-down at the top (options include: Constant size, Lines of Code, Complexity, etc), with links connecting dependencies. When you select/hover over a node, the other nodes that use it are highlighted in green, and the nodes it uses are highlighted in blue. There’s also a couple of contextual information boxes that get populated: one (not shown here) that gives stats about the selected node, and then the context help popup (shown at bottom of screen here). The context help popup is an example of where the user experience is a little rough, as I explain in the User Experience issues section below.
Metrics (Heatmap)

This view allows you to see methods (grouped by assembly) and set the size of each method’s square based on the metric of your choosing via a drop-box at the top. In the screen capture, I have the size based on IL Cyclomatic Complexity, allowing me to quickly see the largest offenders.
Additionally, you can see there are several squares highlighted in blue. This is because they are methods matched by the current code query I have selected in the Query and Rules Explorer view, showing again how the various views can be used with each other to gain additional insight into the code.
Query and Rules Explorer / Editor

When it comes to differentiating this product from others in the same arena, the NDepend Code Query functionality is a huge feature, and the addition of CQLinq in v4.0 makes this even easier to use for .Net developers who are already familiar with LINQ syntax.
This view allows you to use LINQ-style queries to dig into your codebase and create ad-hoc reports using pretty much any code metric you can imagine. And there are dozens of CQLinq queries packaged with NDepend, which include decent in-line documentation and links to additional support references, so writing your own queries is made that much easier as you have a library of examples to copy-and-paste from.
Here’s an example of one of the pre-loaded CQLinq queries: 
You can also import output from NCover, dotCover and TFS in order to include code coverage metric in your queries.
Further, you can compare the results of the current code against a previous run of NDepend to see how the results have changed over time. For example, NDepend provides a set of very useful “Breaking API Changes” CQLinq queries which will show changes (adds, breaking modifies) to publicly accessible members. For an ISV that sells an SDK, such as my employer, this is an extremely useful datapoint to ensure we’re not unintentionally causing breaking changes for our customers between releases, nor exposing additional types that we didn’t intend to expose.
Each of these queries can then be saved as a “rule” which NDepend will enforce. Note the very first line of the above CQLinq says “warnif” – that would result in a warning (vs. an error/failure) when run as a rule. Then, when analysis is run via VisualNDepend, the Visual Studio plugin, or via the console app (say, as part of your build scripts), those rules will be run and the results provided to you (as a red/green while in the bottom corner of VisualNDepend and Visual Studio, or as a result value to fail/pass your builds through the command line).
Abstractness vs Instability

This graphic, which is included in the HTML report, but doesn’t seem to be available in the VisualNDepend UI, was one of the hallmark features the Scott Hanselman discussed in his review of NDepend in 2007. However, I personally don’t find a lot of value in this report for large projects, since the density of the type names obscures the data, as seen in the screen cap. But that’s one of the great things about this tool. It provides many, many different ways to look at the data – and just because I don’t find this view useful doesn’t mean others don’t (case in point: Scott found it useful). I’m a little surprised to find it only on the HTML report and not in the GUI, though.
Feature Gaps:
I didn’t find myself saying “I wish it would do X” very often in relation to feature support. (User experience is another issue – see the User Experience Issues section below for that). There were a few places I felt functionality was missing:
Trouble parsing some files:

There were a few places where NDepend had trouble parsing the source code for my assemblies. Most cases were due to #if #else #endif directive in the code which included braces, like this: 
This is syntactically valid, but NDepend could not parse it, apparently due to the apparent two open braces for one close brace (ie: doesn’t take the directives into consideration). To be fair, other analysis tools, such as Sonar, also had trouble parsing these files for similar reasons.
Additionally, it appears to choke on the .xoml files used for Workflow XAML.
Support for decompilers other than Red Gate’s Reflector:
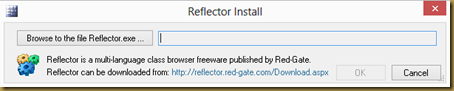
VisualNDepend will open Reflector for an assembly so that you can see further details about it, including reverse compiled code and assembly metadata. At the time this support was added, Reflector was freeware, but was migrated to for-fee licensing well over a year ago. The dialogs in VisualNDepend still reference it as freeware and it’s the only one supported. Given that there are a few prominent and free alternatives (JetBrains dotPeek and Telerik JustDecompile, for example), I think support should be added for those alternatives. I wrote NDepend support asking if they plan to support alternatives (as well as pointing out the now incorrect freeware verbiage) and got the below response, which states I’m the first person to ask for this support. This surprises me and makes me wonder if people are actually using that feature. 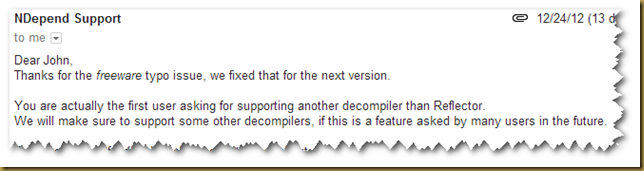
Lack of an installer:
NDepend is distributed as a .zip file with everything packaged inside. This is likely sufficient for the vast major of folks, but there are a couple of times where having an installer option, in addition to the .zip file option, would be nice:
- Licensing. In order to “install” your license, you must place an xml file into the NDepend folder. Your license email comes with these instructions. Having a smart installer could allow me to license the product (or download an existing license without having this email around) and not deal with email MIME issues, etc.
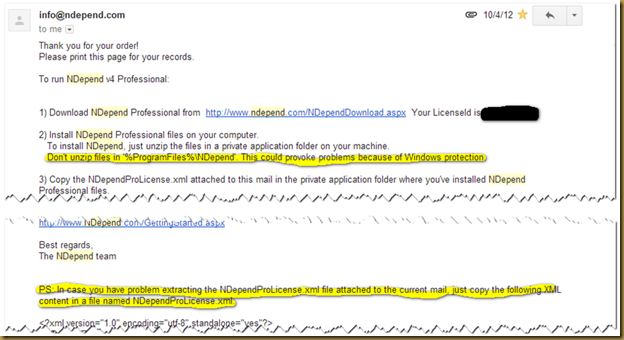
- In the same email, it mentions not installing the files into the Program Files folder due to Windows protection issues. Having an installer publish the files to Program Files will resolve most (all?) of those issues, I believe.
- An installer would allow registration into the Windows Add/Remove Programs database, which is also searchable via other Windows management tools. This would allow system admins to ensure machines have the appropriate versions installed without having to login to each machine and check assembly versions. This could be particularly helpful for build machines utilizing NDepend.

Performance/Resource Utilization:
The analysis runs fairly quickly. For my testing, I used a set of 108 assemblies (1184 namespaces, 29316 types), including about 75 of my own assemblies and the rest being third-party modules my projects use. NDepend analysis took about a minute and a half. By comparison, it took over two and a half minutes to compile and link the assemblies using msbuild/nant scripts. The analysis did consume a decent amount of memory, though. When run in the VisualNDepend GUI, the app's memory footprint started at about 125MB once I loaded my project, then analysis added about 900MB to the app's memory footprint, and about 620MB stayed in memory after the analysis was completed. When run within Visual Studio 2012, the NDepend plugin didn't seem to add much memory footprint when loaded and when analysis was running, the memory usage increased from VS's initial 850MB to approx 1.3GB, but came back down once analysis completed. The console runner seemed to peak out at 350MB. Note that I’m running this on a pretty beefy box with 8 logical processors and 8 GB of memory, running Windows 8 and Visual Studio 2012.
User Experience Issues (VisualNDepend)
As I mentioned in my summary above, the NDepend engine is powerful. But gathering the data is only half the job – reporting and analyzing the data is just as important. The primary tool for analyzing the data is VisualNDepend and it has a lot to be desired from a user experience standpoint.
Ultimately, the tool provides you access to the data. And having the interactive graphical representation of the data in the various views is a powerful feature of the product. However, I continuously found myself cursing under my breath (and sometimes out loud) as I used the application and became increasingly frustrated when it didn’t behave the way I would expect (based on how most other Windows app work) or where UI elements got in my way and made it harder for me to gain access to the information I was seeking.
Looking through old reviews and screenshots of NDepend on the web, it doesn’t look like the UI has changed much since 2007 (the earliest pictures I found in my brief google search). Honestly, with the many dockable internal windows and not making use of the operating system’s chrome / look & feel, it feels a bit like a Windows 3.1 app ported to Win95, or the typical cross-platform Java app that doesn’t really fit into any one platform’s UI scheme. It really makes the product feel unpolished, which I think unfortunately reflects poorly on the power of the underlying engine and the data it provides.
I captured a lot of notes on this topic, and while I’ll be providing those to the NDepend folks, I’ve decided not to laundry list them here. Instead, I’ll give a few key examples so you can get a taste of what type of issues I’m complaining about.
UI elements that get in your way:
The context-sensitive help dialog was the biggest offender here. In particular, in the Dependency Matrix and the Dependency Graph, both of which had a long list of data and scrolled off the page. In these reports, if I was working with elements at the bottom of the visible window, the context dialog would popup, blocking the data I wanted to see and placing itself directly under my mouse, where it stayed visible until I moved my mouse away from it. This meant I was constantly having to move my mouse back and forth across the screen to get to the data elements I wanted to see. Often, I would have to go click on the scrollbars to move the data higher on the screen to escape the dreaded context dialog. This was made worse by the lack of mouse wheel scrolling (see below). I think this could easily be improved by having some smarts around where the context-sensitive help dialog is displayed so that it moves to the side of the screen opposite the current mouse position, thus ensuring it’s never placing itself directly under the mouse and getting in the user’s way.
Mouse wheel usage inconsistent with most Windows apps:
Given that most .Net developers will be heavy users of Visual Studio and other Microsoft products like Office, I personally expect tools that cater to .Net devs to try and align their common keyboard shortcuts and mouse gestures to those in Microsoft products. When that's not the case, I find myself getting frustrated when I, almost by muscle memory, use one of those familiar shortcuts only to find the tool I'm using doesn't react the way I wanted. Case in point, in most of the NDepend interactive views there's more data than can fit on the screen, so 1) data is compacted and 2) scrollbars are used to page the data off screen. I find myself using the scroll wheel on my mouse to navigate the report. In most Microsoft applications, the scroll wheel alone controls vertical pagination (up/down scrollbars), shift+wheel controls horizontal pagination, and cntl+wheel controls zoom. So my first instinct is to use the scroll wheel to move up/down the report; however VisualNDepend uses the scroll wheel to control zoom exclusively (even with shift and/or cntl). Since I have over 100 assemblies in my reports, it's a bit of an annoyance to have to mouse over to the scrollbars in order to scroll up/down. Honestly, this was one of the bigger annoyances, since I continually found myself using the mouse wheel to try and scroll, only to zoom instead.
Error dialogs that weren’t very helpful:
On multiple occasions, I received error messages that gave almost enough information, but didn’t quite take me all the way. Or, were just missing data altogether. For instance, from the heatmap view, if source code is available for the method, you can double-click on the method box and be taken directly to Visual Studio. But if code isn’t available, you get this error message:

"Can’t open declaration in source file. Reason: N/A because the assembly’s corresponding PDB file N/A at analysis time."
You get a similar error if you try to set the heatmap’s metric to some of the options, such as Cyclomatic Complexity, and you don’t have source for every assembly:
"Can’t select the metric ‘Cyclomatic Complexity (CC)’. N/A because one or several PDB file(s) N/A"
It took me a while to realize “N/A” means “Not Available” instead of “Not Applicable”, but in any case I would have preferred the report be built for those assemblies where source was available and exclude the remaining assemblies (or at least give me that option).
Where it fits into a dev organization:
I don’t think it’s extremely useful or cost effective for every developer in an organization to have a copy of NDepend, but I do see two scenarios where NDepend licenses would be a good investment for a dev shop:
- Software architects (those responsible for the overall design of your codebase) and/or QA Leads (those responsible for ensuring the quality of your code) should use the applications to analyze the codebase, perform ad-hoc monitoring for issues and to generate rules for enforcing code quality standards (via CQLinq).
- Build servers in your (continuous) build environment should validate the quality rules and fail the build / report issues for each build.
Note that build server and developer editions are licensed separately, with build machine license pricing being about 50% more expensive. The license I was given as a “Pro” license, which supports both developer and build server editions, but isn’t available for purchase directly.
Build Server integration:
You can take advantage of the NDepend console runner to integrate with your continuous integration/build servers. In my case, I'm using TeamCity, which I personally believe is the best build server out there (and it's free for most users), but this would work just as well with Jenkins and others. There are two key aspects of the console runner that I can take advantage of:
1) If NDepend finds critical rule violations, it will return a non-zero status code. TeamCity (and most build systems) will pick up on this and mark the build as failed. This allows me to enforce coding standards in the build server.
2) An html report is generated that I can expose within the build page of TeamCity. There is some documentation on the NDepend website explaining how to do this, but it's a bit dated (steps to access the settings mentioned have moved in recent versions of TeamCity), but it's close enough for now. I'll write a future blog post explaining exactly how I integrated it in my environment.

Disclaimer / Material Connections Notice:
This is a solicited review, for which I received a free license to the product. While I made no promise of a good (or bad) review in return, and attempted to take a completely neutral approach going into the review, you should be aware of my potential bias. That, and I don’t want the FTC to fine me $11,000
Feedback from NDepend Developer:
Note: Before publishing, I gave Patrick at NDepend a chance to review this posting. Here are some excerpts from his feedback:
"Concerning the lack of installer, this is a long time debate. MSI makes sense indeed, but personally, as a programmer I hate when MSI takes minutes and put link and registry key everywhere behind my back. At least with XCopy deployement there is zero bad surprise, and this might be worth noting."
"Abstractness vs Instability will be included smoothly in the UI."
"Concerning the Context Sensitive Help, you can close it at any time. It is designed for larger screen, and indeed on small laptop screen it might overlap data. We take note of the idea of placing Context Sensitive help at the top when mouse is at the bottom. I see a problem luring though, since we need an heuristic to differentiate when the user wants to hover the tip with the mouse, with when user wants to hover data. I guess we'll have to see if the tips overlap the panel or not."
"Concerning the Ctrl+Mouse Wheel zoom, you are right. We'll propose Ctrl+Mouse Wheel zoom by default + an option to go back to the current state."
"Concerning "N/A" I always saw it as Not Available. Knowing it is N/A because a PDB file is missing, seems a very relevant info to me since it explain you why you don't get the data and hence, how you can get it, isn't it?"