 Update 2014-02-06: The SonarQube .NET ReSharper plugin has been released. See my release announcement. Since my last post announcing my SonarQube plugin, it has been accepted into the SonarQube Community plugins, including hosting of documentation, issue tracking, and builds on the SonarSource servers, and moving the code into the SonarCommunity GitHub repository, with a path for eventual inclusion in the SonarQube Update Center for easy distribution to users.
Before I open the gates and push a formal release to the public, I'd like to get some beta testers to use the plugin and work out any rough edges. If you're using SonarQube for your .Net-based projects, I'd love to have you as an early adopter and get your feedback.
Overview
The basic idea is this: The good folks at JetBrains have released a commandline-based tool (called "InspectCode") allowing users to run ReSharper code analysis outside of Visual Studio and generate an XML-based file listing the various issues it detected in your codebase. Oh, and it's free!
I felt this lined up very well with SonarQube, and wrote a SonarQube plugin to (optionally) execute the ReSharper analysis and consume the results, publishing them into SonarQube as Issues, allowing users to take advantage of the management, planning, reporting, etc, features of SonarQube to manage their code quality and technical debt.
What You Can Expect To See
Something like this in Visual Studio: 
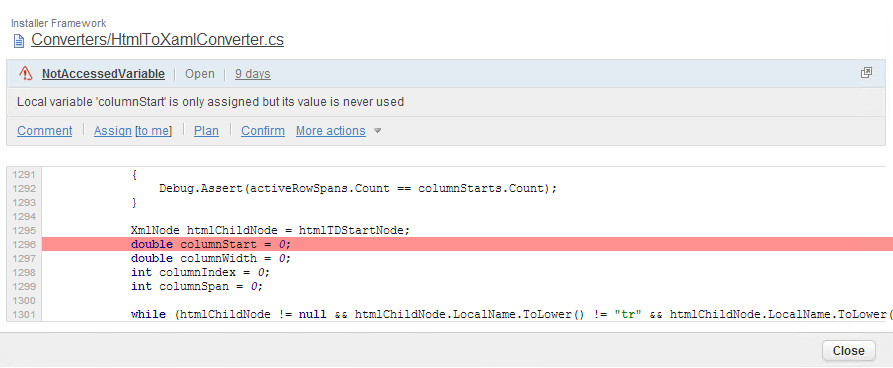
Will turn into this in SonarQube: 
How To Get Started
For this beta, I'm assuming you're already a SonarQube user and have successfully configured analysis for your .Net solutions. If that's not the case, take a look at my post on setting up SonarQube analysis for C# projects.
The official documentation for installing this plugin can be found on the SonarQube Wiki page for this plugin, which I'm still building out, and will change over time to reflect the current state of things. For now, here's the process:
Download resharper EAP and run a local analysis First, make sure the InspectCode tool is working for you. Download the ReSharper Command Line Tools (they come as a .zip file) and extract them into the folder of your choosing. For the purpose of this posting, I'm assuming you used C:\jetbrains-commandline-tools\.
Open a command prompt and run inspectcode.exe /help. You should see a usage statements printed to the console.
Now change into the folder with your VS Solution file and run the command c:\jetbrains-commandline-tools\inspectcode.exe /output=resharper-results.xml YourSolutionFile.sln
Warning: This may take a very long time to run, possibly a couple hours for very large projects. I would suggest starting with a small project and maybe grabbing some lunch.
One this completes, you should have a resharper-results.xml file in your solution folder, which will look a little like this:
<?xml version="1.0" encoding="utf-8"?>
<!-- Generated by InspectCode 8.0.0.0 -->
<Report ToolsVersion="8.0">
    <Information>
        <Solution>Example.sln</Solution>
        <InspectionScope>
            <Element>Solution</Element>
        </InspectionScope>
    </Information>
    <IssueTypes>
        <IssueType Id="CSharpWarnings::CS0162" Category="Compiler Warnings" Description="CS0162:Code is unreachable" Severity="WARNING" />
        <IssueType Id="CanBeReplacedWithTryCastAndCheckForNull" Category="Potential Code Quality Issues" Description="Type check and direct cast can be replaced with try cast and check for null" Severity="SUGGESTION" />
        <IssueType Id="ClassNeverInstantiated.Global" Category="Potential Code Quality Issues" Description="Class is never instantiated: Non-private accessibility" Severity="SUGGESTION" />
        <!-- ... -->
    </IssueTypes>
    <Issues>
        <Project Name="Example.Application">
            <Issue TypeId="RedundantUsingDirective" File="Example.Application\\Program.cs" Offset="910-943" Line="22" Message="Using directive is not required by the code and can be safely removed" />
            <Issue TypeId="RedundantUsingDirective" File="Example.Application\\Program.cs" Offset="945-963" Line="23" Message="Using directive is not required by the code and can be safely removed" />
            <!-- ... -->
        </Project>
        <Project Name="Example.Core">
            <Issue TypeId="RedundantUsingDirective" File="Example.Core\\IMoney.cs" Offset="895-908" Line="21" Message="Using directive is not required by the code and can be safely removed" />
            <Issue TypeId="RedundantUsingDirective" File="Example.Core\\IMoney.cs" Offset="910-943" Line="22" Message="Using directive is not required by the code and can be safely removed" />
            <!-- ... -->
        </Project>
    </Issues>
</Report>
If that all works, then you're ready to start using the plugin.
- Download the sonar-dotnet-resharper-plugin from the build server and place it in your
SONARQUBE_SERVER_HOME/extensions/pluginsfolder. - Restart your SonarQube service
- Login to the SonarQube server with an admin account and head over to the
Quality Profilespage and select the profile used by your .Net project (this may be the "Sonar way" profile, or one you've created on your own). - In the search fields, set the Repository to
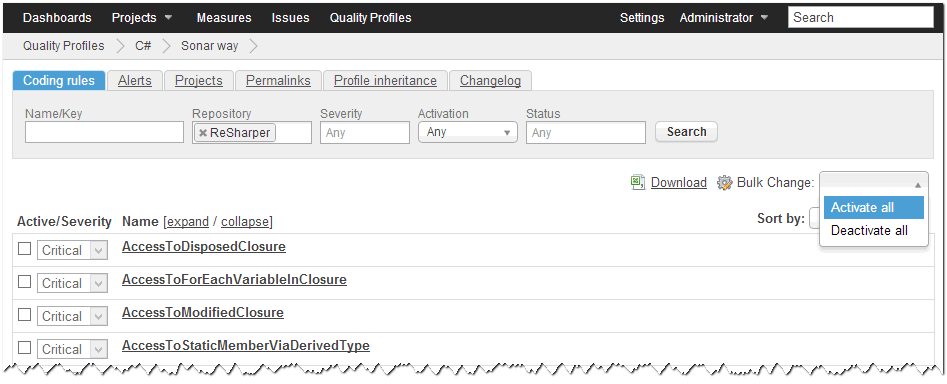
ReSharperand the Activation toAnyand click "Search". You should be presented with a list of approx 650 rules supported by ReSharper's tool. In the upper right corner of the results list is aBulk Changeoption. ChooseActivate all. This will (immediately) activate all of the ReSharper rules for this profile.

- Modify your
sonar-project.propertiesfile to include the following:
    # ReSharper settings
    sonar.resharper.mode=reuseReport  #leave blank (run ReSharper during sonar analysis), 'skip' to deactive, or 'reuseReport' (recommended) and provide a previously generated results file
    sonar.resharper.report.path=$(SolutionDir)/resharper-results.xml
    #sonar.resharper.installDirectory=c:/jetbrains-commandline-tools  #only needed if running during sonar analysis
    #sonar.resharper.timeoutMinutes=10 #optional, and only if running during sonar analysis
- Execute sonar-runner and get yourself a cup of coffee. For really big projects this could take half and hour or more.
- Bask in the glory of your new ReSharper-based Issues in the SonarQube web UI.
A Note About Rule Severity
ReSharper users a four-tier severity (plus a "Do Not Show" option), while SonarQube uses a five-tier system. I have mapped the ReSharper values like this:
| ReSharper | SonarQube |
|---|---|
| Error | Blocker |
| Warning | Critical |
| - | Major |
| Suggestion | Minor |
| Hint | Info |
| Do Not Show | Info |
While some of the ReSharper rules are marked as Do Not Show by default, the plugin maps them to Info so that you can modify their visibility via the Quality Profile. If you want them to not show, disable the rules in the Quality Profile. You can, of course, change any of these levels for any rule using the Quality Profile, and I fully expect most people will want to downgrade a lot of the Critical rules to Major and a lot of Info to be turned off.
Reuse Report vs Run During Analysis
The ReSharper analysis can be very time consuming for large solutions with many projects, sometime taking multiple hours to run if the cache has to be rebuilt, so I would suggest users favor the reuseReport mode when possible. This reduces the number of times the analysis is executed, since running it during the sonar-runner will analyze each project separately, adding significant analysis time, even with heavy caching in the ReSharper tool.
To use the reuseReport option you'll need to use the inspectcode.exe utility to analyze your solution before executing sonar-runner. There are several command line options for the tool, but at minimum, you’ll need this:
inspectcode.exe -o=resharper-results.xml YourSolutionName.sln
Where -o=resharper-results.xml will write the results into the file name you provide. Note: by default (without the -o argument), inspectcode will write the file to the temp directory. You’ll need this file to provide to the plugin.
Analysis times
The amount of time required to run the inspectcode analyzer and import the results into SonarQube can vary based on several factors. Here is some representative data to give you some guidance on how long it will take, based on two actual projects I'm analyzing.
| Small Project | Larger Project | |
|---|---|---|
| Lines of Code | 27,515 | 593,979 |
| VS Projects in Solution | 10 | 39 |
| Standalone InspectCode | 4min | 1hr 24min |
| Sonar-Runner (ReuseReport) | 2min | 35min |
| Sonar-Runner (embedded InspectCode) | 11min | 2hr 58min |
All cases had an existing ReSharper cache. Excludes unsupported project types, such as WiX (installer) projects. Includes only the .NET ReSharper plugin and the base C# plugins (ie: does not include FxCop, Gallio/Unit Tests, etc). Timings are based on running within a TeamCity CI build on a decently powerful server. Obviously, your times will vary and these represent only a guidepost for how much variation can happen between runs.
Known Issues / Limitations
The ReSharper command line tools are fairly new and still have a few kinks to work out. I would suggest always using the newest possible version, including new EAP builds of 8.1 while it is still in development.
Inconsistent results from inspectcode
From one run to the next, you may get a different list of rule violations from ReSharper, even without code changes. This means you will have violations come and go in SonarQube without the underlying issue actually being addressed. In my tests, for a large project like the Windows Azure .net library, I saw a 4% difference (~430 rules delta on ~12,000 total)
See RSRP-390005 - inspectcode provides inconsistent results
Data quality issues in available rules
With the 8.1 EAP builds, JetBrains has added a commandline switch to inspectcode to dump the list of possible issuetypes that could be reported. There are a couple of data issues in that output, which I have worked around in the plugin:
See RSRP-390380 - inspectcode /dumpIssuesTypes includes duplicate entries for "StructuralSearch" and RSRP-390375 - IssueType "InvocationIsSkipped" has undocumented "INFO" severity
"Sonar.UnknownIssueType" Violation
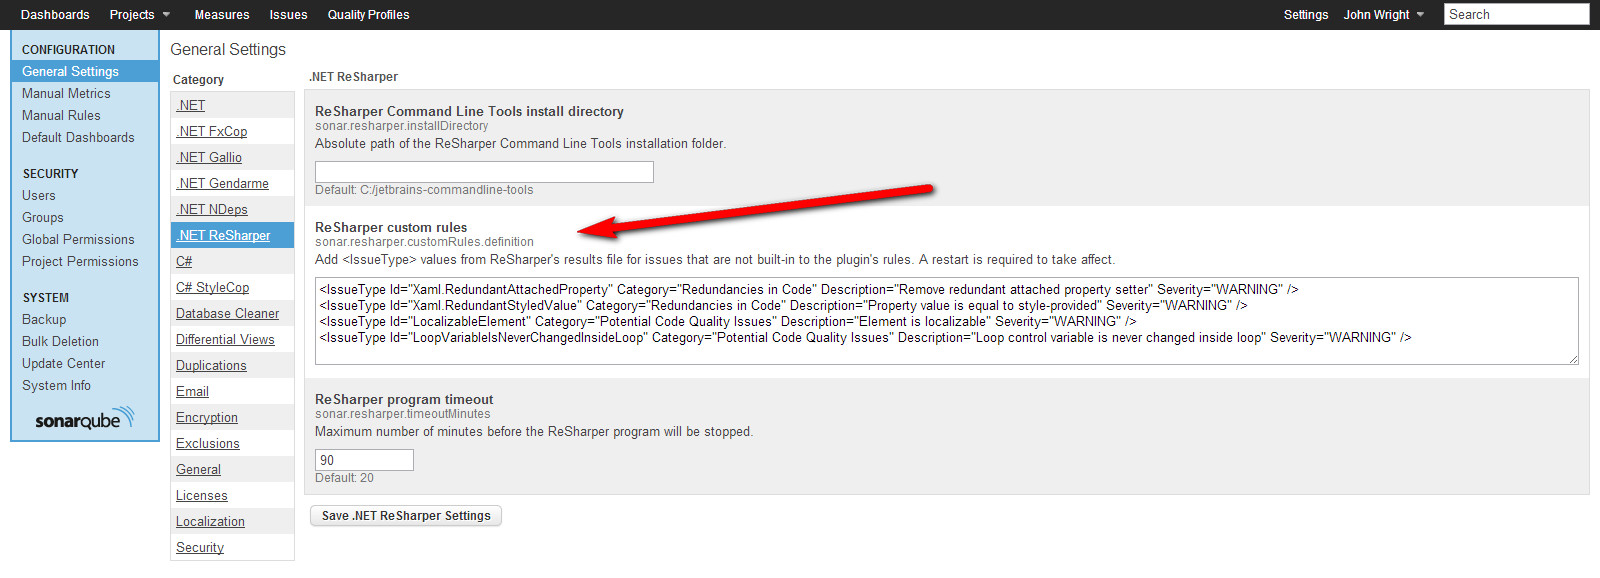
SonarQube requires that the rule database be populated up front, at server start. ReSharper provides a list of possible violation types for their tool via the /dumpIssuesTypes argument, and I've populated the SonarQube rule repository using these values. However, as new versions come out, or you add your own ReSharper plugins to generate new IssueTypes, it’s possible that you will have violations in your code that the plugin did not know about when the server started, so cannot import into SonarQube appropriately. When the plugin comes across one of these, it will write a log statement (to the runner’s log) and generate a "Sonar.UnknownIssueType" violation with instructions on how to add the rule information to the 'ReSharper custom rules' property in the Settings UI. After adding that setting and restarting SonarQube, future analysis runs will support those IssueTypes.

Other File Types
While the ReSharper tools support the full .Net stack, including .xaml and other file types, The sonar-dotnet API does not currently support more than one language (C# or VB.net) for a given project. For .xaml and other files, the plugin attempts to report the violation against the file, but they may end up attached to the project instead. In either case, the source code for the .xaml or other unsupported file type will not be imported into SonarQube.
Future plans and release timeline
There are a handful of things I want to see before I release version 1.0, which will go out in the Update Center for general public consumption:
- ReSharper 8.1 released. I feel like the 8.0 release of the command line tools just isn't viable for use with SonarQube, primarily due to the inconsistent results from one run to the next. This also ensures any breaking changes they make before 8.1 ships are caught and addressed in the plugin. JetBrains has not publicly stated when they thing 8.1 will be released.
- A handful of early adopters are using the plugin and providing feedback (and are happy with it).
- I've addressed any high-value tickets in JIRA. I'm using the NETRESHARPER-1.0 release to track things targeted for the public release.
Other features I'm hoping to include, but are not guaranteed:
- additional configuration settings to modify the inspectcode arguments when running directly. For example: ability to set the cache folder path, disable solution-wide analysis, use of a R# settings file, etc.
- utilize and document ReSharper plugins in the inspectcode analysis. This is a core feature we're looking to utilize at work to make the dev-time experience match the CI server analysis for company coding standards enforcement. This may "just work", but is dependent on JetBrains releasing the 8.1 SDK nuget packages, which will be "later this autumn".
Disclaimers
I am not associated with JetBrains in any way, aside from being a big fan of many of their products. I have, however, received free licenses to JetBrains products (ReSharper and dotPeek) over the years via raffles over the years at the Chicago Alt.Net Users Group, which is sponsored by JetBrains.